Question 5:
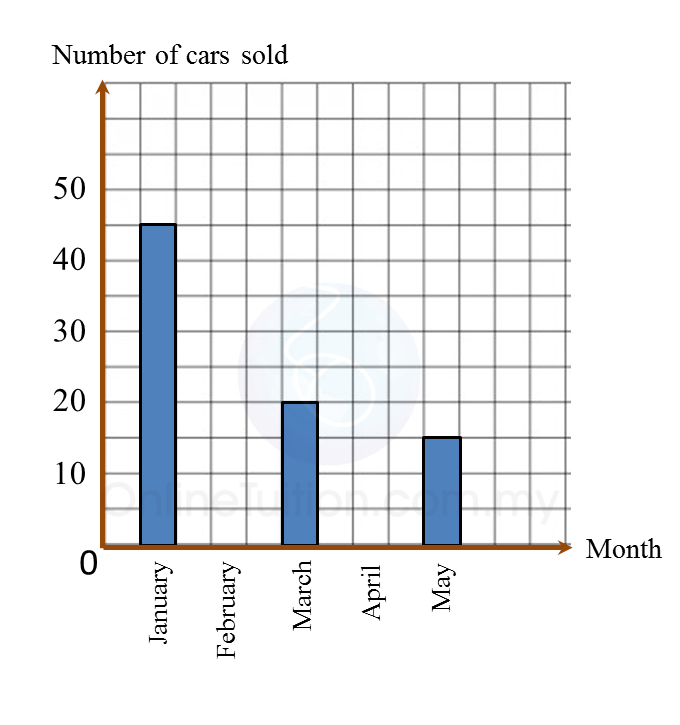
Diagram below is an incomplete bar chart which shows the number of cars sold in a shop for duration of five months.
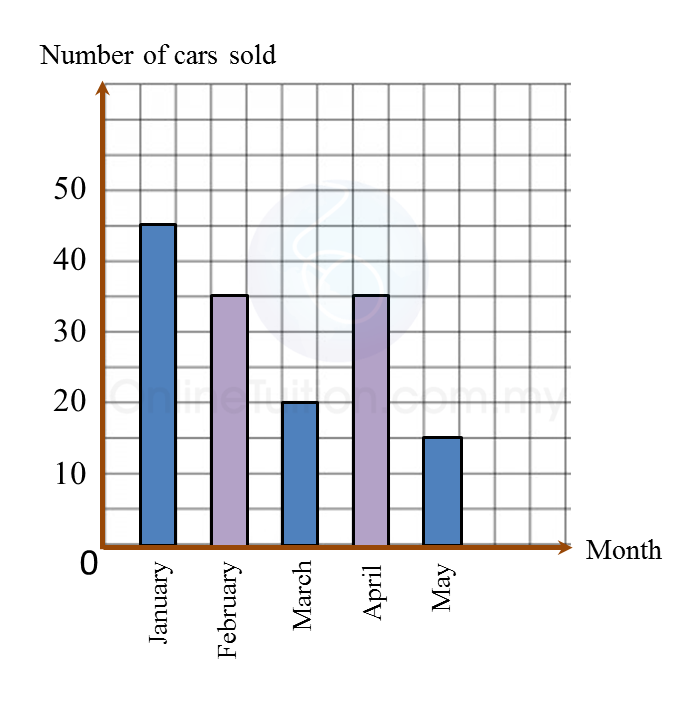
 (a) The number of cars sold for the five months is 150 units. The number of cars sold in February is equal to the number of cars sold in April.
Complete the bar chart in the Diagram.
(b) Find the percentage of cars sold in January.
Solution:
(a)
 (b)
(b)
Diagram below is an incomplete bar chart which shows the number of cars sold in a shop for duration of five months.
 (a) The number of cars sold for the five months is 150 units. The number of cars sold in February is equal to the number of cars sold in April.
Complete the bar chart in the Diagram.
(b) Find the percentage of cars sold in January.
Solution:
(a)
 (b)
(b)Question 6:
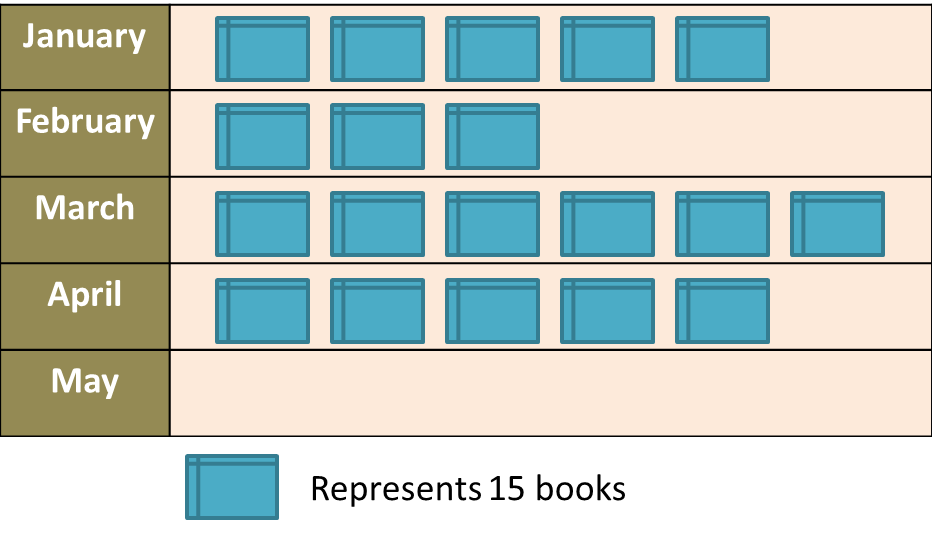
Diagram below is an incomplete pictograph showing the sales of books for a duration of five months.

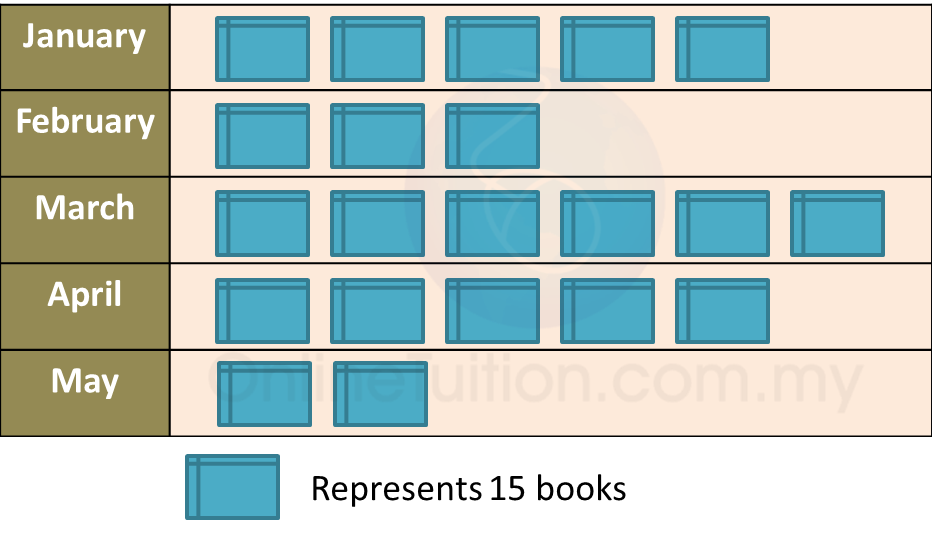
(a) The sales in May is ¼ of the total sales in January and February.
Complete the pictograph in the Diagram.
(b) Find the total number of books sold before April.
Solution:
(a)

(b)
Total number of books sold before April
= (5 + 3 + 6) × 15
= 14 × 15
= 210
Diagram below is an incomplete pictograph showing the sales of books for a duration of five months.

(a) The sales in May is ¼ of the total sales in January and February.
Complete the pictograph in the Diagram.
(b) Find the total number of books sold before April.
Solution:
(a)

(b)
Total number of books sold before April
= (5 + 3 + 6) × 15
= 14 × 15
= 210