12.2.2 Data Handling, PT3 Focus Practice
Question 3:
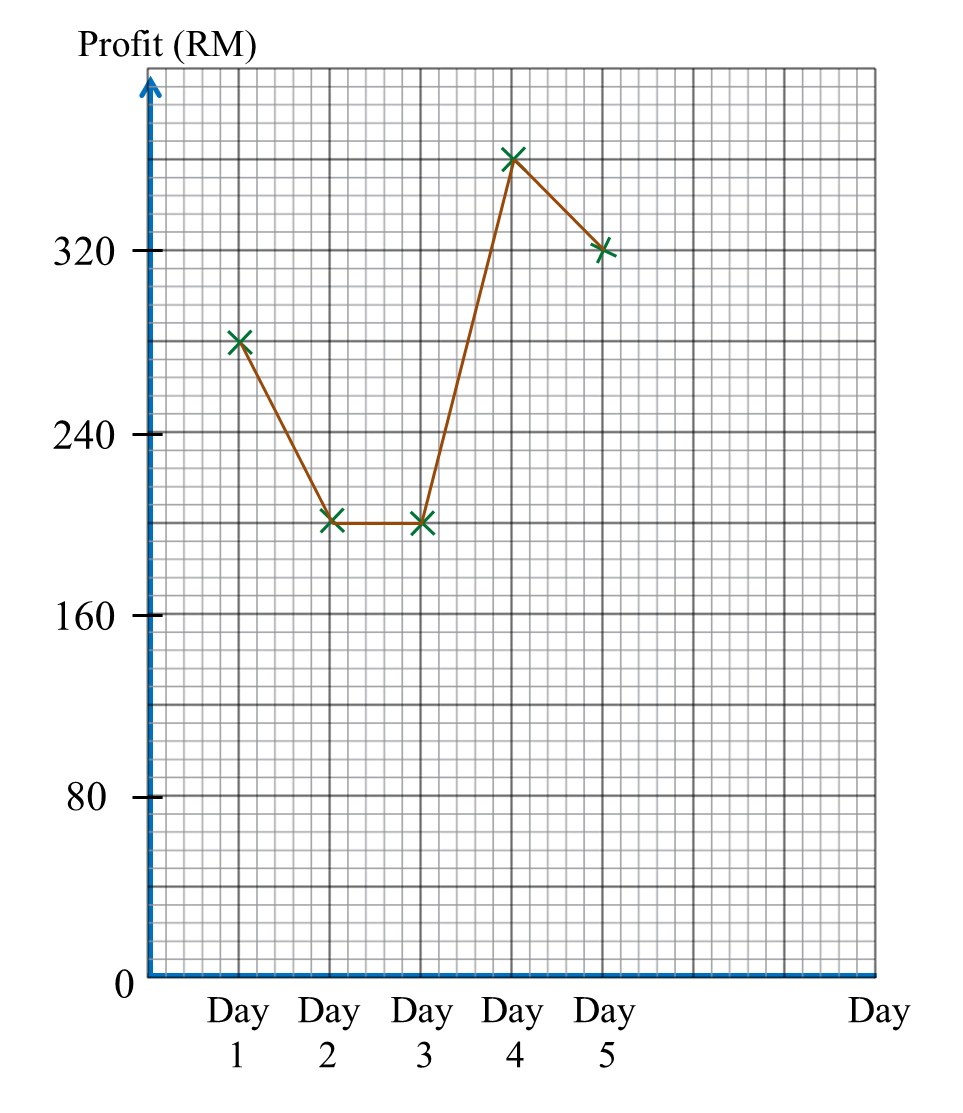
Table below shows the profit made from the sales of coconut at a stall over five days.
|
Day
|
Day 1
|
Day 2
|
Day 3
|
Day 4
|
Day 5
|
|
Profit (RM)
|
280
|
200
|
200
|
360
|
320
|
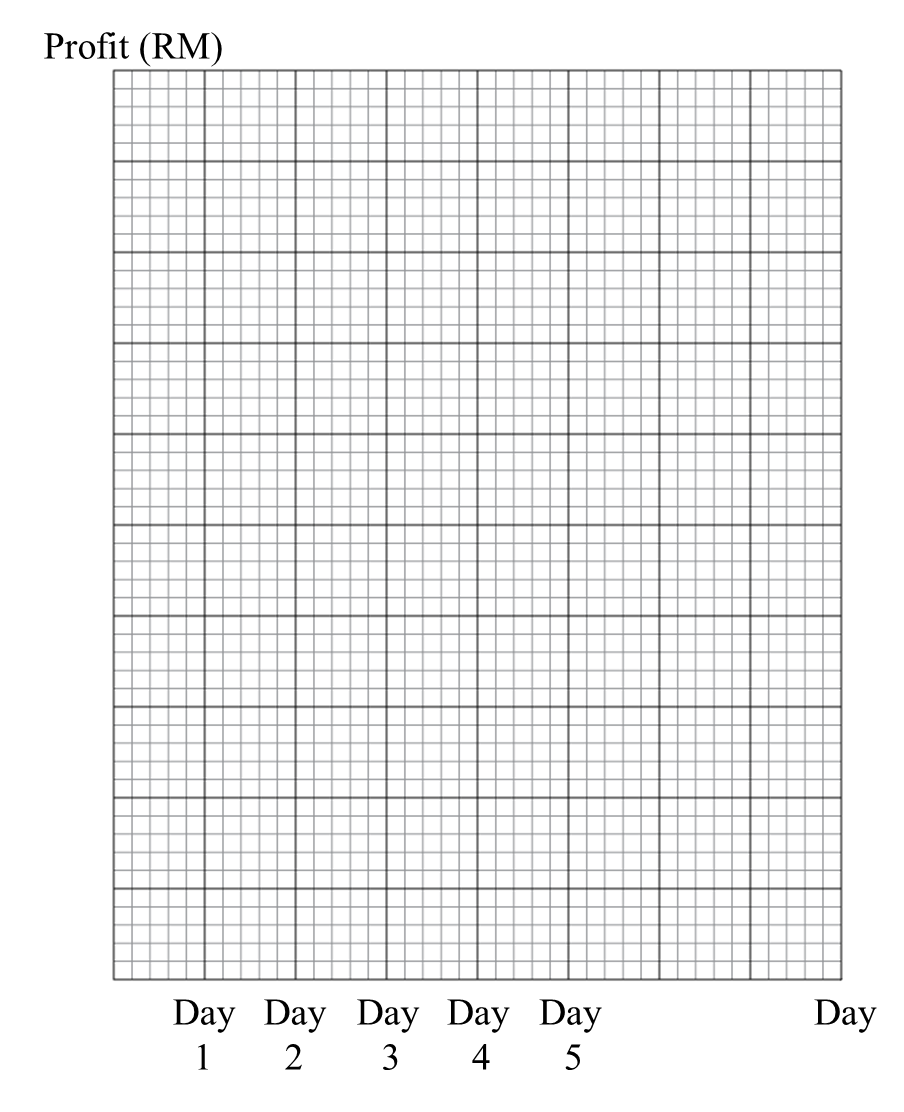
On diagram in the answer space, draw a line graph to represent all the information in the Table. Use the scale 2 cm to RM80 on the vertical axis.
Answer:
Solution:
Question 4:
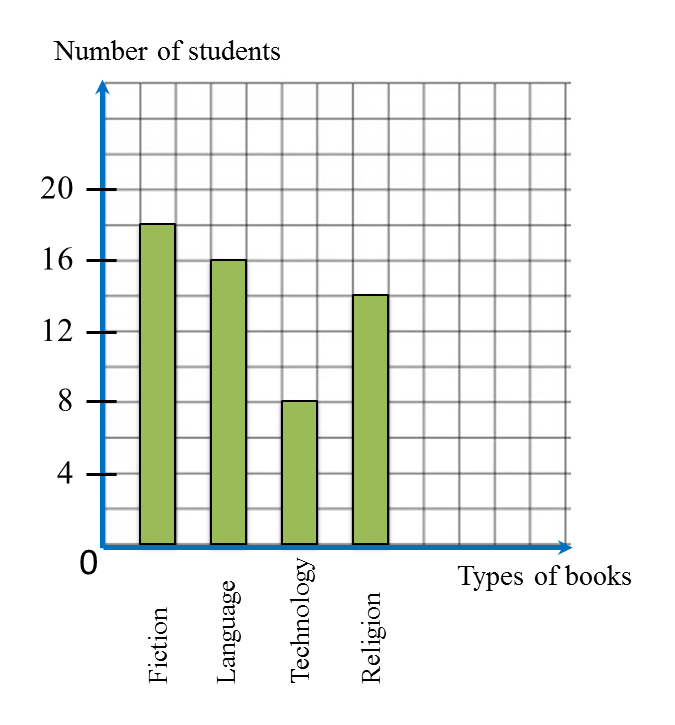
Table below shows the number of students who read four types of books.
|
Types of books
|
Fiction
|
Language
|
Technology
|
Religion
|
|
Number of students
|
18
|
16
|
8
|
14
|
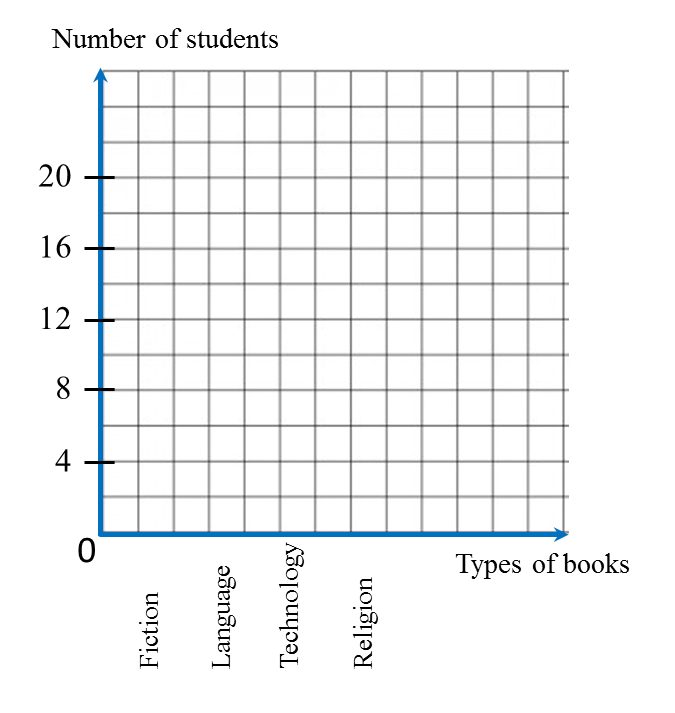
On diagram in the answer space, draw a bar chart to represent all the information in the Table.
Answer:
Solution: