Question 7:
Table below shows the number of companies that gave contributions to an orphan fund over a period of five days.
|
Days
|
Monday
|
Tuesday
|
Wednesday
|
Thursday
|
Friday
|
|
Number of companies
|
8
|
14
|
m
|
17
|
11
|
It is given that 20% of the total contribution was made on Tuesday.
Calculate the value of m.
Solution:
Let C = Total contribution
Question 8:
Diagram below shows an incomplete line graph of the number of eggs sold in four weeks. The number of eggs sold on week 1 is 2000 and 4000 on week 4.
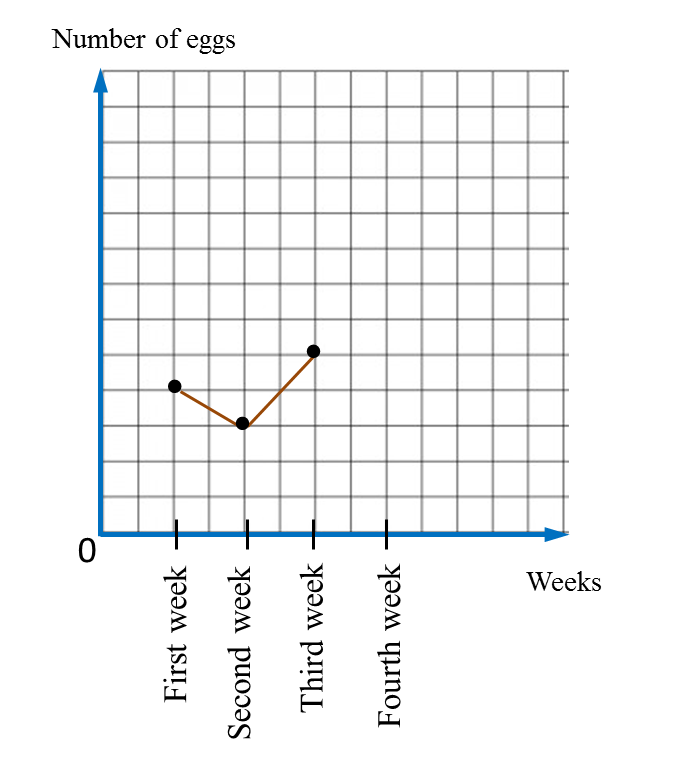
(a) Complete the line graph in the Diagram.
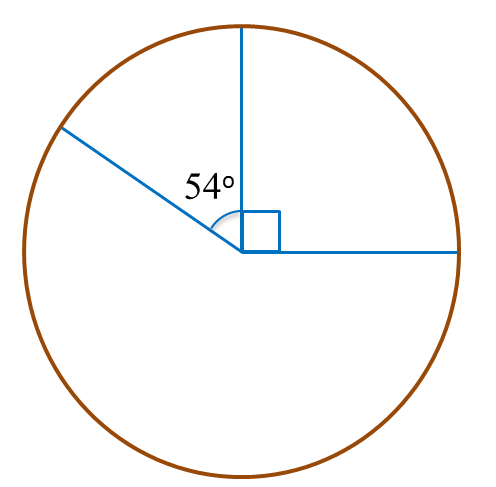
(b) Complete the pie chart in the second Diagram to represent sales from Week 1 to Week 4.
Solution:
(a)
(b)
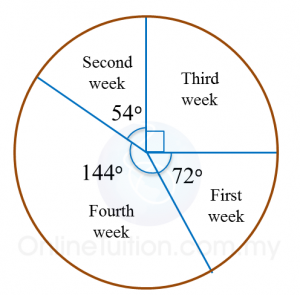
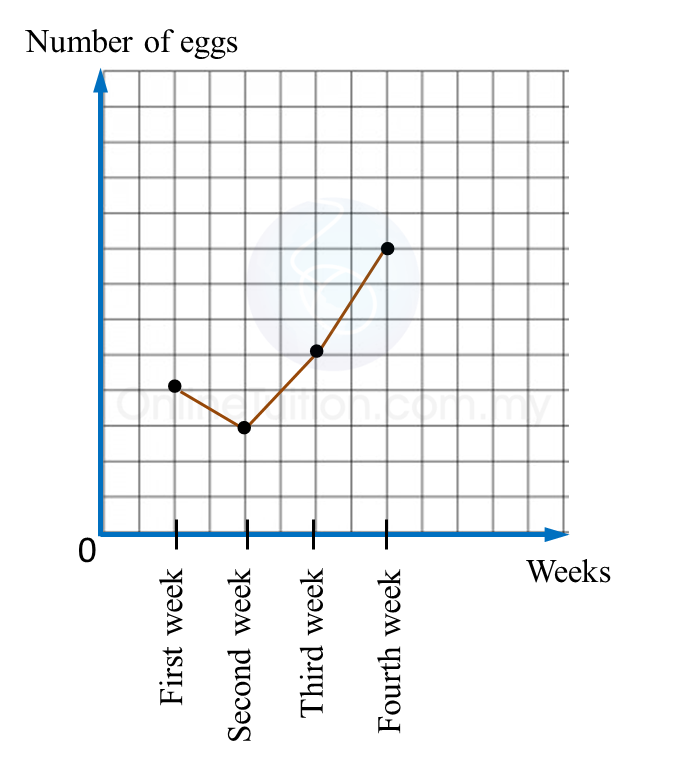
Diagram below shows an incomplete line graph of the number of eggs sold in four weeks. The number of eggs sold on week 1 is 2000 and 4000 on week 4.
(a) Complete the line graph in the Diagram.
(b) Complete the pie chart in the second Diagram to represent sales from Week 1 to Week 4.
Solution:
(a)
(b)