12.2.1 Data Handling, PT3 Focus Practice
Question 1:
Diagram below is a pictograph showing the number of pizzas sold in three months.

The price of one pizza is RM18. The total sales for those four months are RM2250.
Calculate the number of pizzas sold in April.
Solution:
Total number of pizzas sold in four months
Total number of pizzas sold in first three months
= 9 × 10
= 90
Number of pizzas sold in April
= 125 – 90
= 35
Question 2:
Diagram below is a bar chart showing the number of new houses sold over four days.
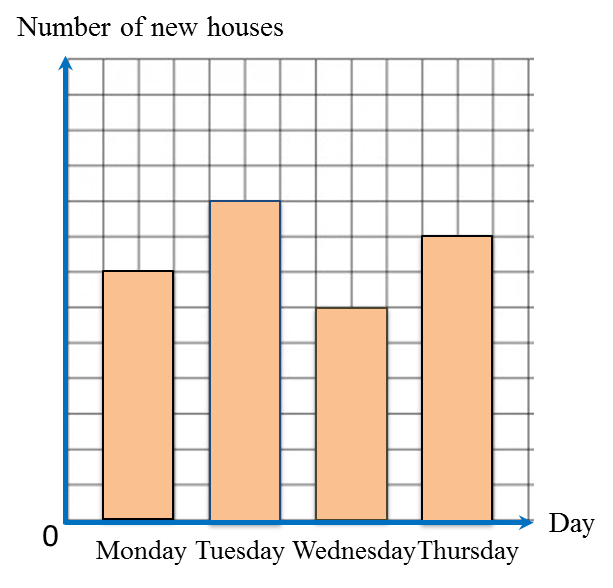
The total number of new houses sold on Wednesday and Thursday is 56.
Calculate the total number of new houses sold on Monday and Tuesday.
Solution:
Wednesday: 12 units
Thursday: 16 units
Number of houses represented by 1 unit
Monday: 14 units
Tuesday: 18 units
Total number of new houses sold on Monday and Tuesday
= (14 + 8) × 2
= 64