Question 9 (a):
Given a function of y = x2 – 2x + 3. x and y are variables.
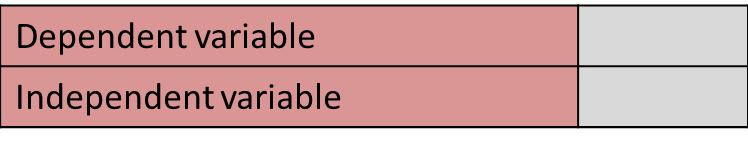
(i) Fill in the box with the correct answer.
(ii) Diagram 9.1 shows the graph of the function.
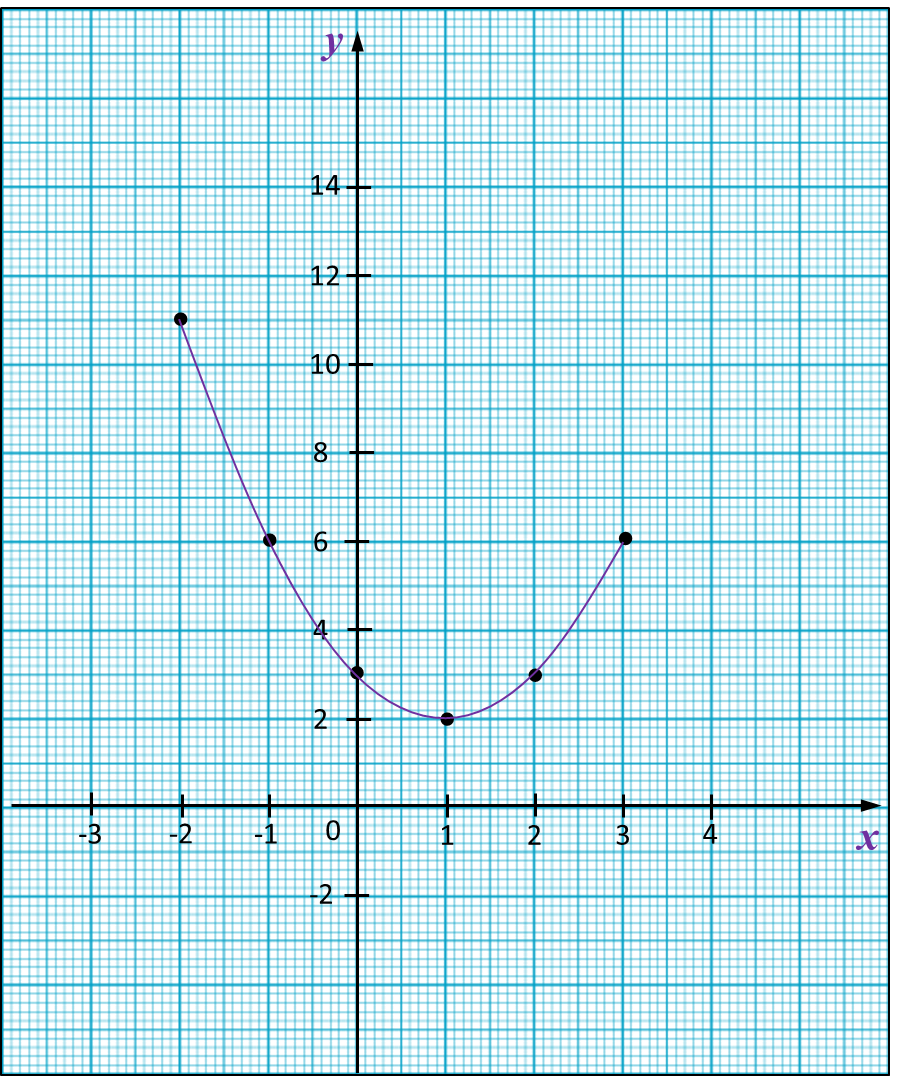
The scale used at y-axis is 2 cm to _______ units.
Solution:
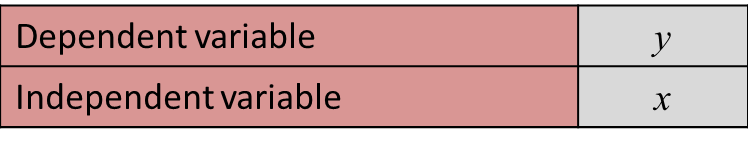
(i)
(ii)
The scale used at y-axis is 2 cm to 2 units.
Given a function of y = x2 – 2x + 3. x and y are variables.
(i) Fill in the box with the correct answer.
(ii) Diagram 9.1 shows the graph of the function.
The scale used at y-axis is 2 cm to _______ units.
Solution:
(i)
(ii)
The scale used at y-axis is 2 cm to 2 units.
Question 9 (b):
Diagram 9.2 shows a right angled triangle PRT. Q, S and U are the midpoints of lines PR, RT and PT respectively
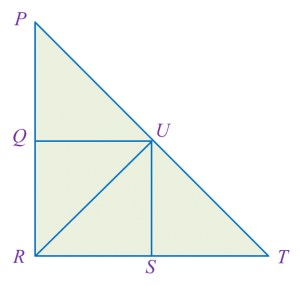 Diagram 9.2
(i) The triangle TSU is the image of the triangle TRP under an enlargement.
State the centre of the enlargement and the scale factor.
Answer:
(ii) Latifah wants to make a pattern on a scarf as shown in Diagram 9.2. The triangle PQU is blue in colour.
Using the concept of reflection, which triangle in Diagram 9.2 that needs to be coloured in blue?
State the axis of reflection.
Answer:
Solution:
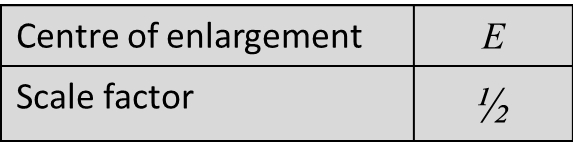
(i)
(ii)
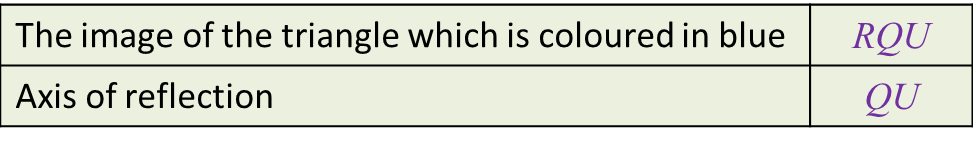
Diagram 9.2 shows a right angled triangle PRT. Q, S and U are the midpoints of lines PR, RT and PT respectively
Diagram 9.2(i) The triangle TSU is the image of the triangle TRP under an enlargement.
State the centre of the enlargement and the scale factor.
Answer:
(ii) Latifah wants to make a pattern on a scarf as shown in Diagram 9.2. The triangle PQU is blue in colour.
Using the concept of reflection, which triangle in Diagram 9.2 that needs to be coloured in blue?
State the axis of reflection.
Answer:
Solution:
(i)
(ii)
Question 9 (c):
Table 9.3 shows the number of vehicles passing through a toll plaza. The number of lorries in October is not stated.
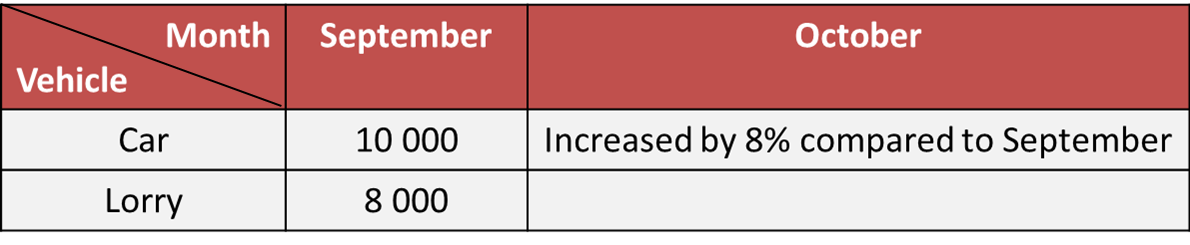
The number of cars and lorries in October are the same.
Calculate the percentage increase of the number of lorries in October.
Solution:
Table 9.3 shows the number of vehicles passing through a toll plaza. The number of lorries in October is not stated.
The number of cars and lorries in October are the same.
Calculate the percentage increase of the number of lorries in October.
Solution: