8.2.2 Graphs of Functions, PT3 Focus Practice
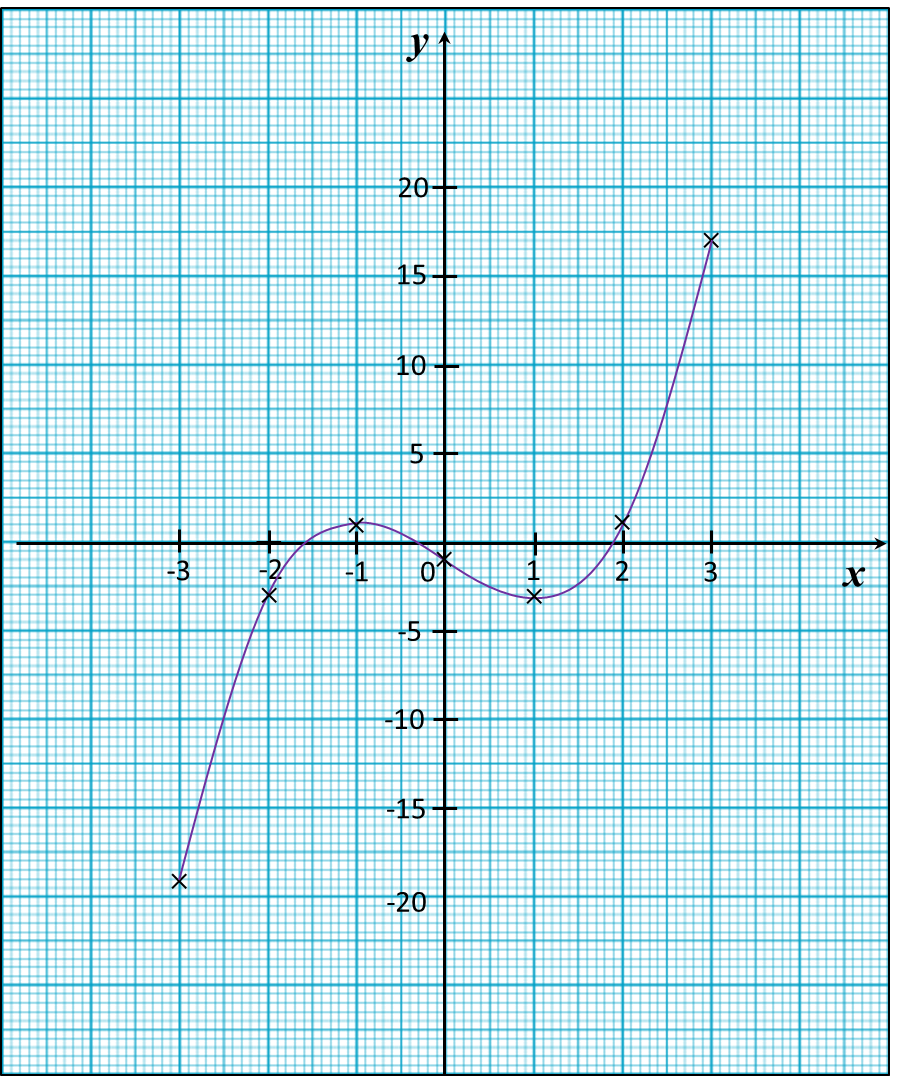
Question 4:
Use graph paper to answer this question.
Table below shows the values of two variables, x and y, of a function.
|
x
|
–3
|
–2
|
–1
|
0
|
1
|
2
|
3
|
|
y
|
–19
|
–3
|
1
|
–1
|
–3
|
1
|
17
|
The x-axis and the y-axis are provided on the graph paper on the answer space.
(a) By using a scale of 2 cm to 5 units, complete and label the y-axis.
(b) Based on the table above, plot the points on the graph paper.
(c) Hence, draw the graph of the function.
Answer:
Solution:
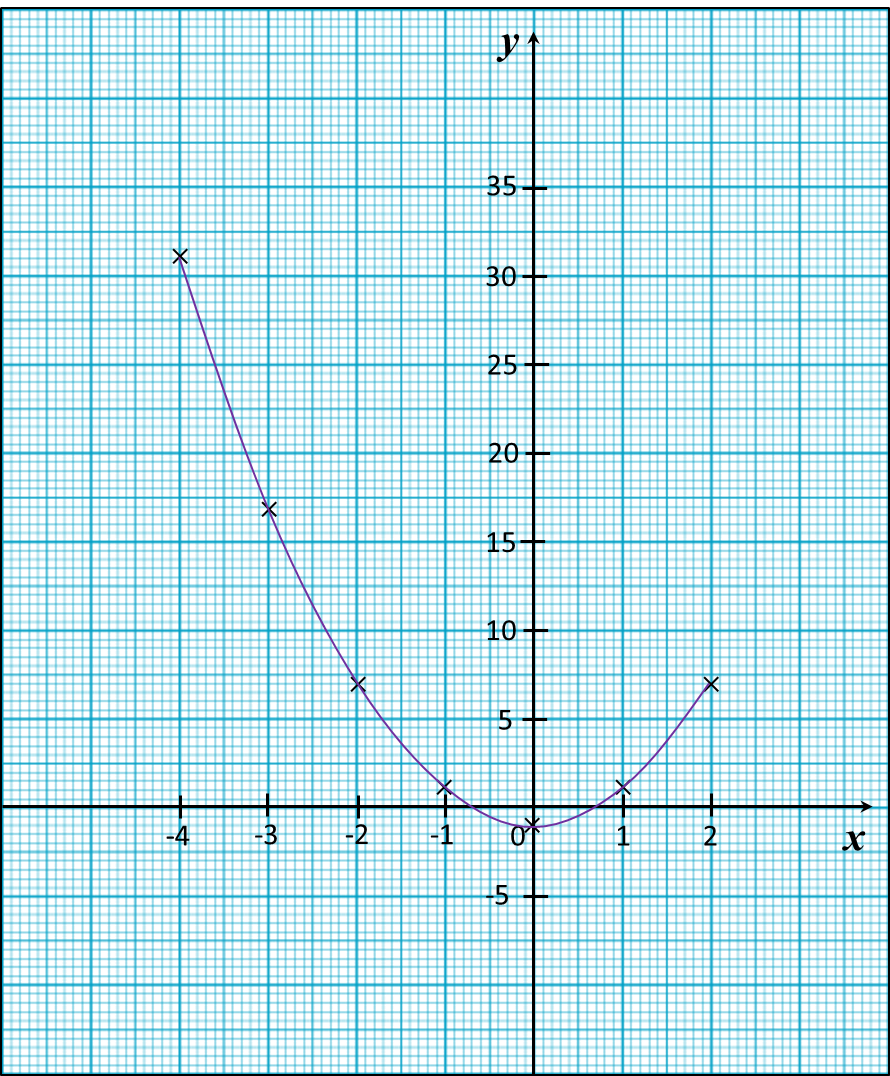
Question 5:
Use graph paper to answer this question.
Table below shows the values of two variables, x and y, of a function.
|
x
|
–4
|
–3
|
–2
|
–1
|
0
|
1
|
2
|
|
y
|
31
|
17
|
7
|
1
|
–1
|
1
|
7
|
The x-axis and the y-axis are provided on the graph paper on the answer space.
(a) By using a scale of 2 cm to 5 units, complete and label the y-axis.
(b) Based on the table above, plot the points on the graph paper.
(c) Hence, draw the graph of the function.
Answer:
Solution: