Question 10 (a):
Diagram 10.1 is a pie chart showing Ahmad’s monthly expenses.
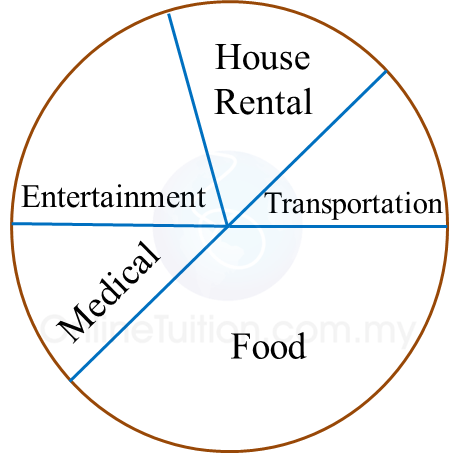
(i) State the mode.
(ii) The following data are the height of students in a class.
132 cm, 125 cm, 137 cm, 130 cm, 128 cm
Calculate the mean.
Solution:
(i) Food
(ii)
Diagram 10.1 is a pie chart showing Ahmad’s monthly expenses.
(i) State the mode.
(ii) The following data are the height of students in a class.
132 cm, 125 cm, 137 cm, 130 cm, 128 cm
Calculate the mean.
Solution:
(i) Food
(ii)
Question 10 (b):
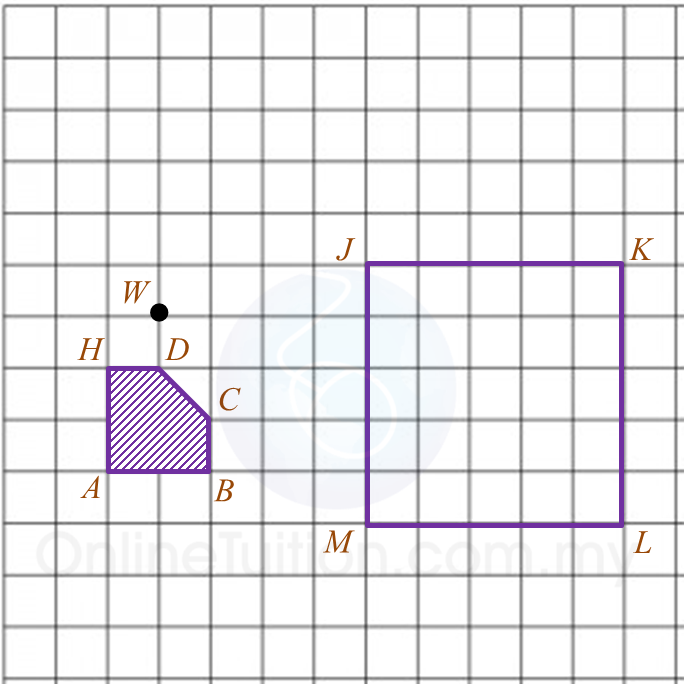
Diagram 10.2 shows a polygon HABCD and a square JKLM.
(i) Under a transformation, polygon HABCD will be transformed such that the image will be placed inside the square JKLM. The image formed based on the following conditions:

Suggest one possible complete transformation.
(ii) Using the transformation that you have suggested in (b)(i), mark the new position of point W in Diagram 10.2.
Answer:
Solution:
(i)
(ii)
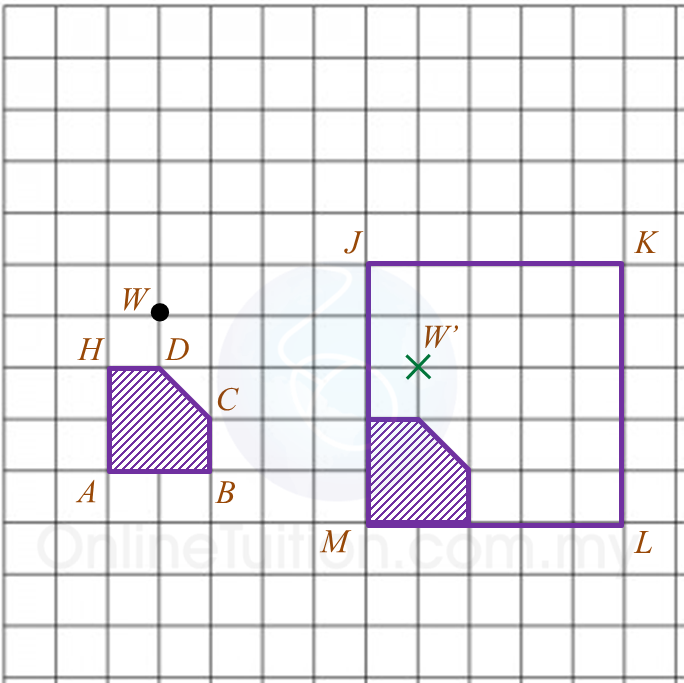
Diagram 10.2 shows a polygon HABCD and a square JKLM.
(i) Under a transformation, polygon HABCD will be transformed such that the image will be placed inside the square JKLM. The image formed based on the following conditions:
Suggest one possible complete transformation.
(ii) Using the transformation that you have suggested in (b)(i), mark the new position of point W in Diagram 10.2.
Answer:
Solution:
(i)
(ii)
Question 10 (c):
Diagram 10.3 shows a car route from P to S. The driver starts the journey from P. When he reaches R, he turns back and travels ¼ the distance of P to R and then he continues to S to finish his journey.
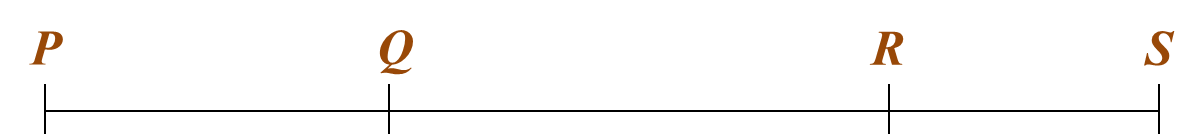
Table 10 shows the distance between the destinations.
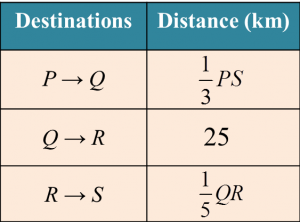
Assuming that the distance travelled in the journey when the driver turns back as a wasted distance, calculate the fraction of the wasted distance to the distance of the whole journey.
Solution:
Diagram 10.3 shows a car route from P to S. The driver starts the journey from P. When he reaches R, he turns back and travels ¼ the distance of P to R and then he continues to S to finish his journey.
Table 10 shows the distance between the destinations.
Assuming that the distance travelled in the journey when the driver turns back as a wasted distance, calculate the fraction of the wasted distance to the distance of the whole journey.
Solution:
Wasted distance is 2x 10KM. since distance is total journey.
Thanks for pointing out our mistake.
Correction had been made accordingly.