Question 6:
Use graph paper to answer this question.
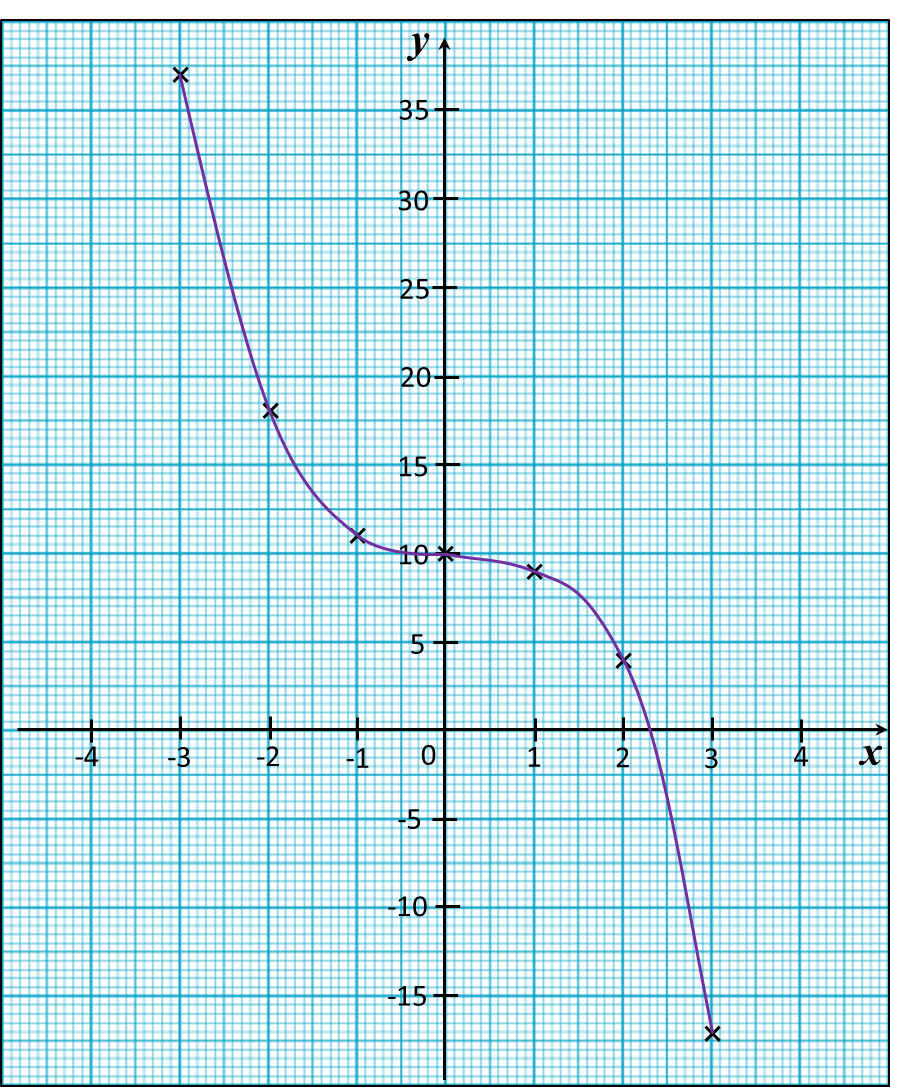
Table below shows the values of two variables, x and y, of a function.
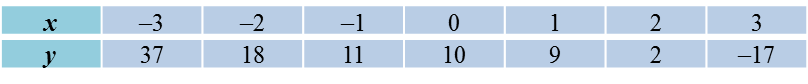
The x-axis and the y-axis are provided on the graph paper on the answer space.
(a) By using a scale of 2 cm to 5 units, complete and label the y-axis.
(b) Based on the table above, plot the points on the graph paper.
(c) Hence, draw the graph of the function.
Answer:
Solution:
Use graph paper to answer this question.
Table below shows the values of two variables, x and y, of a function.
The x-axis and the y-axis are provided on the graph paper on the answer space.
(a) By using a scale of 2 cm to 5 units, complete and label the y-axis.
(b) Based on the table above, plot the points on the graph paper.
(c) Hence, draw the graph of the function.
Answer:
Solution:
Question 7:
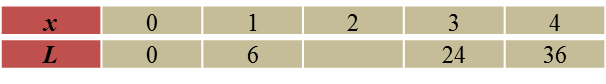
(a) Complete table below in the answer space for the equation L = x2 + 5x by writing the value of L when x = 2.
(b) Use graph paper to answer this part of the question. You may use a flexible curve rule.
By using a scale of 2 cm to 1 unit on the x-axis and 2 cm to 5 units on the y-axis, draw the graph of L = x2 + 5x for 0 ≤ x ≤ 4.
Answer:
Solution:
(a)
When x = 2
L = 22 + 5(2)
= 4 + 10
= 14
(b)
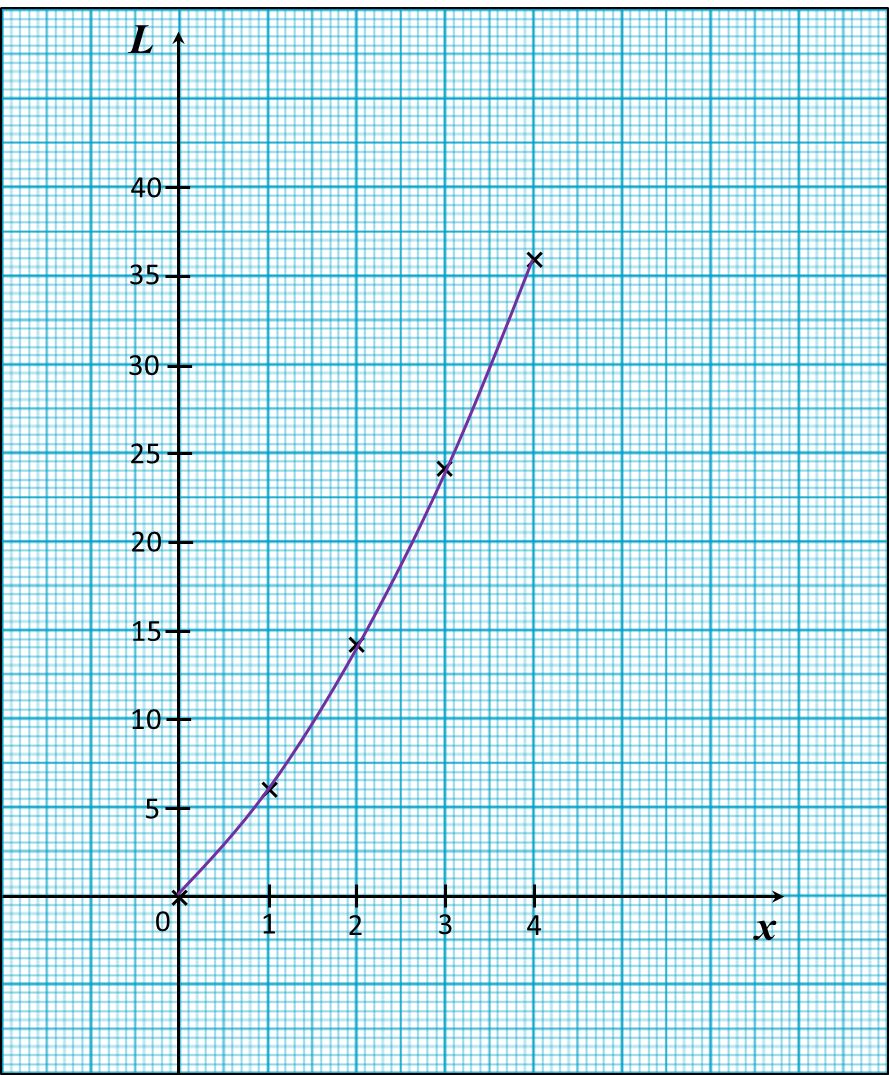