Question 4:
Table below shows the scores for a group of pupils in a sport game.
|
Score
|
1
|
2
|
3
|
4
|
5
|
|
Number of pupils
|
4
|
11
|
5
|
3
|
2
|
Calculate the percentage number of pupils who obtain scores more than the mode score.
Solution:
Mode score = 2
Number of pupils who obtain scores more than 2
= 5 + 3 + 2
= 10
Total number of pupils
= 4 + 11 + 5 + 3 + 2
= 25
Percentage number of pupils who obtain scores more than the mode score
Question 5:
The mean age of Alex, Michelle and their three children is 34 years. The mean age of their three children is 20 years.
Calculate the mean age of Alex and Michelle.
Solution:
Total age = 34 × 5 = 170 years
Total age of their three children
= 20 × 3
= 60 years
Total age of Alex and Michelle
= 170 – 60
= 110 years
Mean age of Alex and Michelle
Question 6:
Diagram below is a pie chart showing the number of mangosteens eaten by 4 boys.
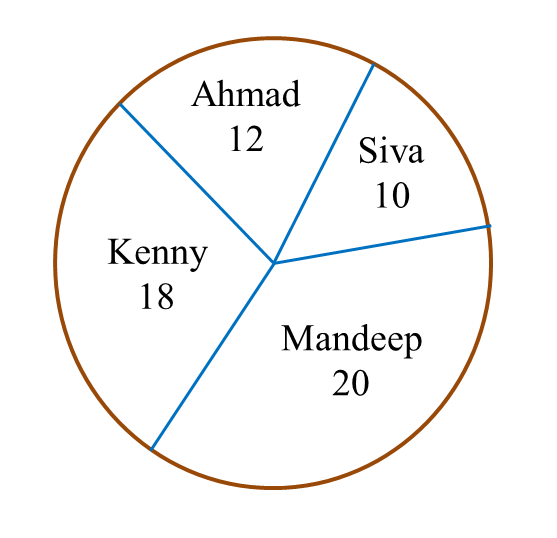
Calculate
(a) the mean number of mangosteens eaten by a boy,
(b) the angle of the sector representing Kenny.
Solution:
(a)
(b)